Example simulationModeled estimate, not a forecast
45-seat ramen restaurant
- Location
- Alameda, California
- Startup budget
- $175,000
- Average spend
- $28
- Scenario
- Moderate demand · opens Mar 2027
- Year 1 revenue
- $748,000
- 26,661 customers · 85/open day
- Operating profit
- $123,000
- After labor, rent, COGS and overhead
- Operating margin
- 16.4%
- Before owner pay and debt service
- Break-even
- Month 2
- Startup costs paid back ~month 14
Timeline · 36 months
Watch your business over three years
Scroll the timeline and the shop changes with it: traffic, seasons and modeled events. Year 1 is simulated day by day; years 2 and 3 are projected from where year 1 ends. The further out you look, the wider the range and the lower the confidence — small surprises compound.
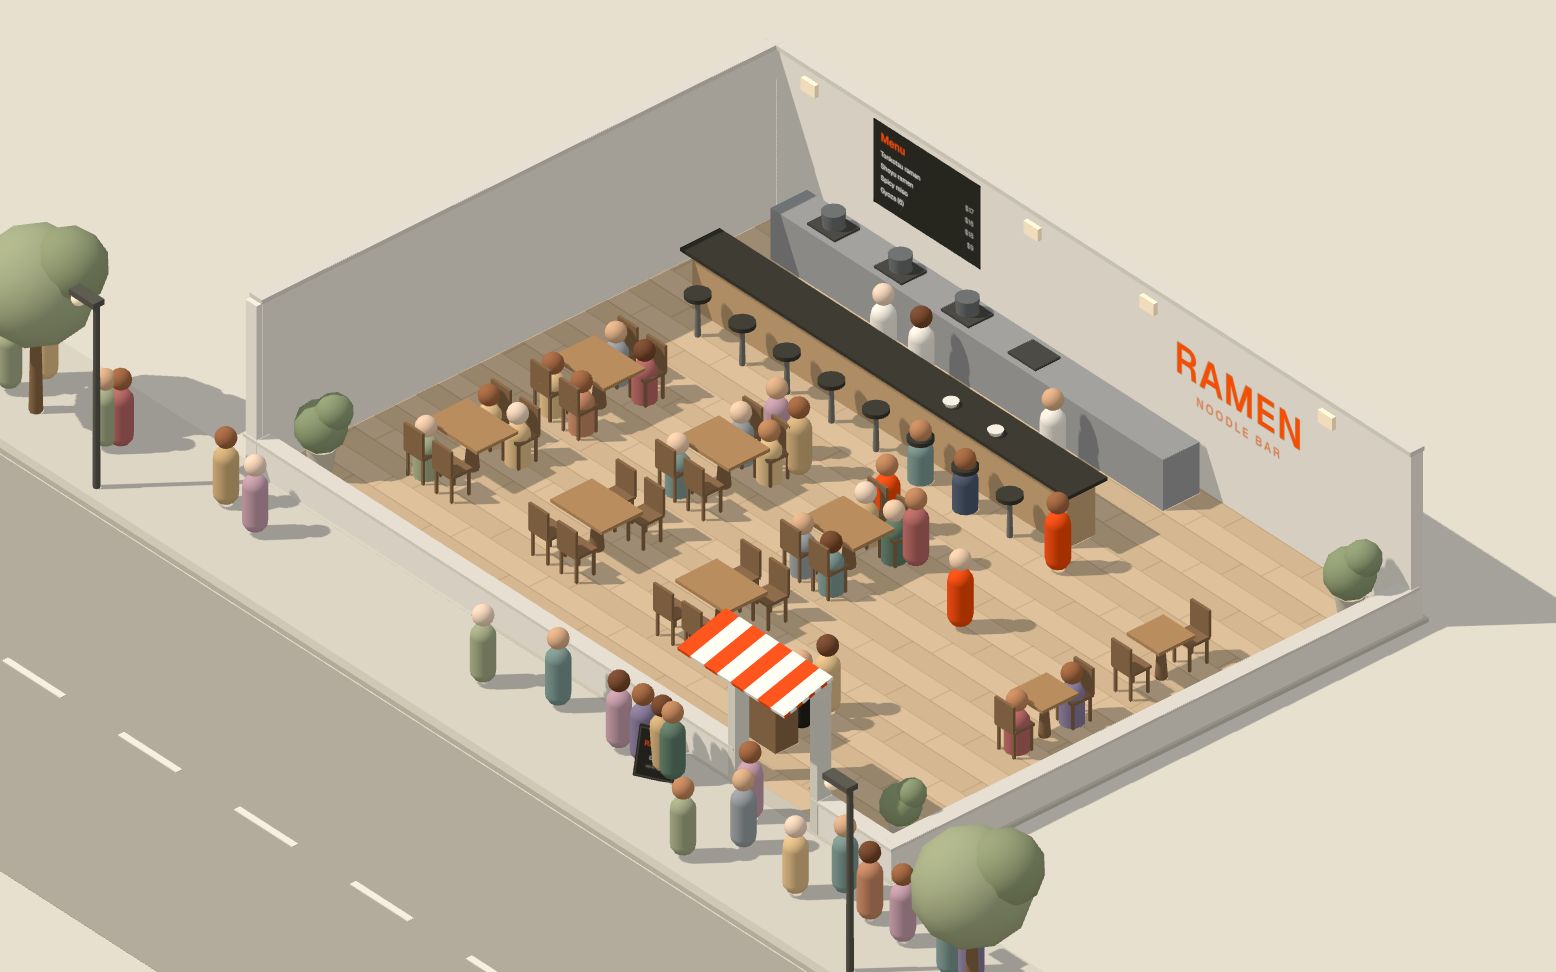
Year 1 · simulated day by day
Year 2 · projected from year 1
Year 3 · projected — least certain
Forecast confidence is the share of 300 simulated futures whose revenue for that month lands within ±25% of the expected value. It measures how much the simulations agree — it is not a guarantee. The haze in the 3D view thickens as confidence falls. Years 2–3 assume your steady-state week continues with seasonality, in today’s dollars.
12-month operating model
Where the money goes
- Cost of goods$235,000 · 31%
32% of each sale
- Labor$211,000 · 28%
180 hrs/week incl. payroll taxes
- Rent$78,000 · 10%
$6,500/mo
- Marketing$18,000 · 2%
$1,500/mo
- Other operating costs$84,000 · 11%
Utilities, insurance, card fees, supplies
- Operating profit$123,000 · 16.4%
Before owner pay, debt service, depreciation and income taxes.
Cash position
- Lowest point
- $19,000 · M1
- End of year 1
- $143,000
Probability range
Conservative10th percentile
$522K
revenue
−$34,000 operating profit
No sustained break-even in year 1
ExpectedYour assumptions
$748K
revenue
$123,000 operating profit
Break-even month 2
Optimistic90th percentile
$1M
revenue
$267,000 operating profit
Break-even month 1
Year 1 operating profit across simulated years
80% of simulated years fall in the shaded band · dot = expected ($748K)
80% of simulated years fall in the shaded band · dot = expected ($123K)
Analyst notes
Strength
Breaks even at 64% of expected traffic
Once established, the model needs about 63 customers per open day to cover costs, against the 99 you expect.
Watch
Rent is 10% of revenue
Workable, but rent will weigh on slow months. Try the “Reduce rent 15%” scenario to see the sensitivity.
Strength
Startup costs paid back around month 14
Modeled operating profit recovers the estimated pre-opening spend within two years.
366 simulated days
A Day Inside Your Business
- 11 AMDoors open13
- 12 PMLunch rush20
- 1 PMTapering off11
- 2 PMSlow period3
- 3 PMSlow period3
- 4 PMSlow period6
- 5 PMDinner rush14
- 6 PMPeak demand22
- 7 PMPeak demand21
- 8 PMTapering off12
- 9 PMClosing down5
Each square ≈ 1 customer. Outlined squares were turned away at capacity (31/hour, limited by staff).
- Today’s revenue
- $3,602
- Labor
- −$672
- COGS
- −$1,129
- Overhead
- −$652
- Est. operating profit
- $1,149
Example modeled events
Coming next · Market discovery
Product concept preview — not live market recommendationsWhat if you don’t know what business to open?
Future versions of Brick Sims will search markets for opportunities based on your budget, location and target return.
Boba Shop
- Estimated investment
- $92K
- Modeled owner profit
- $104K/yr
- Risk
- Medium
Indoor Play Café
- Estimated investment
- $97K
- Modeled owner profit
- $143K/yr
- Risk
- Medium–High
Small Arcade
- Estimated investment
- $81K
- Modeled owner profit
- $78K/yr
- Risk
- Medium
Immersive Experience
- Estimated investment
- $89K
- Modeled owner profit
- $169K/yr
- Risk
- High
Full simulation · early access
Want the full business simulation?
The prototype runs on your assumptions. The full simulation we’re building adds market data and a deeper model — delivered as a report you can take to a landlord, partner or lender.
- 12-month cash flow
- Daily demand simulation
- Competitor analysis
- Location analysis
- Sensitivity testing
- Startup-cost model
- Break-even analysis
- AI recommendations
- PDF business report
Early access is free. We’re inviting people in batches as the full model comes online.
What you just used
Prototype simulation · free
A first-year model from your assumptions and category benchmarks. The planned Pro analysis adds location and competitor data, scenario comparison and a downloadable report.
Planned
Planned Pro Simulation
$19per complete business analysis
- 12-month simulation
- Location analysis
- Scenario comparison
- Full financial model
- Downloadable report
We’re measuring interest before launch. No payment is collected.
Brick Sims is an exploratory modeling tool. Simulation outputs are estimates based on user-provided assumptions and should not be considered financial, investment, legal or professional advice.